apen
Approximate Entropy
| Aliases | approximate_entropy, apen |
| Domain | nonlinear |
| Distribution family | Normal |
| Equation | log(C_m(r) / C_{m+1}(r)) |
| Resource intensity | ◍◍◍◍◌ high, Nonlinear subgraph (template matching / embedding — O(N²) worst case). (measured, see §Resources) |
Definition
Approximate entropy. Formally: log(C_m(r) / C_{m+1}(r)).
What does normal look like?
Fitted normative prior: Normal(μ = 0.7606, σ = 0.2711), KS p = 4.1e-22, n = 61715.
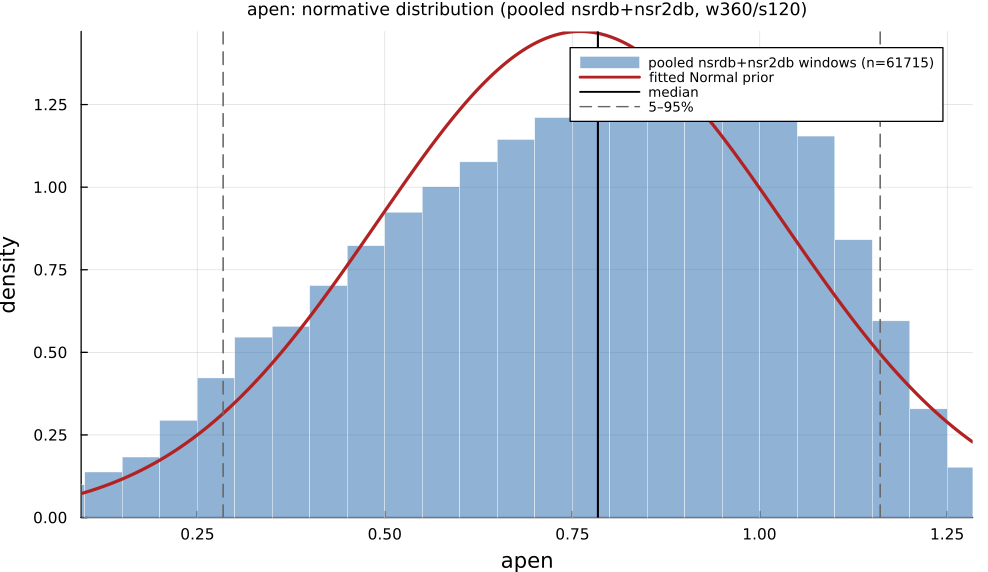
Empirical distribution over the pooled nsrdb+nsr2db normative windows (360-beat windows, 120-beat stride), overlaid with the fitted Normal prior density. Vertical lines mark the median and the 5–95% range.
Normal-range summary (pooled nsrdb+nsr2db)
| statistic | value |
|---|---|
| median | 0.7842 |
| IQR (25–75%) | 0.5635 – 0.9761 |
| 5–95% range | 0.2845 – 1.161 |
| mean ± sd | 0.7606 ± 0.2711 |
| n windows | 61715 |
n varies by feature only through per-window validity over the full pooled nsrdb+nsr2db table (n up to 61 715; e.g. sampen/mse drop windows where the statistic is undefined). ulf is the one exception: a 360-beat (~5 min) window contains no ULF-band power, so it uses a long-window NSRDB-only extraction (see its own page).
Use cases
- Regularity / predictability of the RR series (Pincus 1991).
- Discriminating pathological from healthy dynamics (use adequate N).
- Note the self-match bias: prefer SampEn when possible.
Applications by area
Evidence is reported at the measure-family level; a specific variant may not be the exact index measured in every cited study.
Clinical
Coverage: statistics. A pooled literature; reviews or meta-analyses exist.
Commonly used for autonomic-complexity/regularity assessment (diabetic neuropathy, CHF, depression, aging mortality); the dominant "loss of complexity with disease" narrative is not universal: several well-cited studies report the opposite (higher/more erratic entropy in CHF, higher blood-pressure SampEn predicting higher mortality in a large aging cohort), and a 2026 scoping review of 55 studies explicitly withholds a pooled effect size due to methodological heterogeneity.
Dominant reported direction: mixed: mostly down (loss of complexity) in disease, reversed in some CHF/BP-signal studies.
Key references: (Yang et al., 2026); (Richman and Moorman, 2000).
Sports & peak performance
Coverage: individual papers. A small, scattered literature with no pooled meta-analysis.
Used only sporadically: a 19-study systematic review of HRV and overtraining in soccer found zero studies used any nonlinear/entropy index. Where used, reduced entropy/increased regularity tracks fatigue and intense training load, and higher resting entropy loosely tracks fitness, but samples are small (n = 11–34) and often only descriptive.
Dominant reported direction: down with fatigue/training load (sparse literature).
Key references: (Yang et al., 2026).
Contemplative practice
Coverage: individual papers. A small, scattered literature with no pooled meta-analysis.
Most studies report increased entropy/complexity with meditation practice (a "healthy variability" framing), but effect sizes are frequently small and non-significant in small pilots, and at least one apparent SampEn increase disappeared after covariate adjustment; no dedicated meta-analysis of entropy in meditation exists.
Dominant reported direction: up (fragile: often non-significant or vanishes on adjustment).
Key references: (Yang et al., 2026).
See the effect-distribution meta-analysis page for the harvested per-study effect sizes/p-values behind these domain summaries (docs/zoo_gen/effect_stats.csv).
Resources
Resource-intensity rank ◍◍◍◍◌ high is measured: median wall-clock time and allocations over a 360-beat window on synthetic realistic RR (docs/zoo_gen/bench_resources.jl; full grid in resource_bench.csv).
| metric (360-beat window) | value |
|---|---|
| cold median wall-time | 2.915 ms |
| warm median wall-time | 2.148 ms |
| allocations (cold) | 4.2 MiB |
Cold = fresh memoization caches (builds every shared representation from scratch); warm = shared representations (diff, periodogram, Poincaré coords, DFA fluctuation) already cached, so only this feature is recomputed. The tier is derived from the cold cost; see Nonlinear subgraph (template matching / embedding — O(N²) worst case).
Citation
Approximate entropy, Pincus (1991), PNAS.
Seminal reference(s): (Pincus, 1991).
See the References page for the full bibliography.