hurst
Hurst Exponent
| Aliases | hurst_exponent, hurst |
| Domain | nonlinear |
| Distribution family | Beta |
| Equation | H from R/S analysis |
| Resource intensity | ◍◍◌◌◌ low, Nonlinear subgraph (template matching / embedding — O(N²) worst case). (measured, see §Resources) |
Definition
Hurst exponent. Formally: H from R/S analysis.
What does normal look like?
Fitted normative prior: Beta(α = 2.883, β = 6.17), KS p = 1.2e-21, n = 61715.
Note: hurst is theoretically bounded to (0, 1) (Beta, as declared in the Features.jl docstring), but the observed 360-beat-window values leave that interval (see the 5–95% range below), so the empirical fit shown here is Normal.
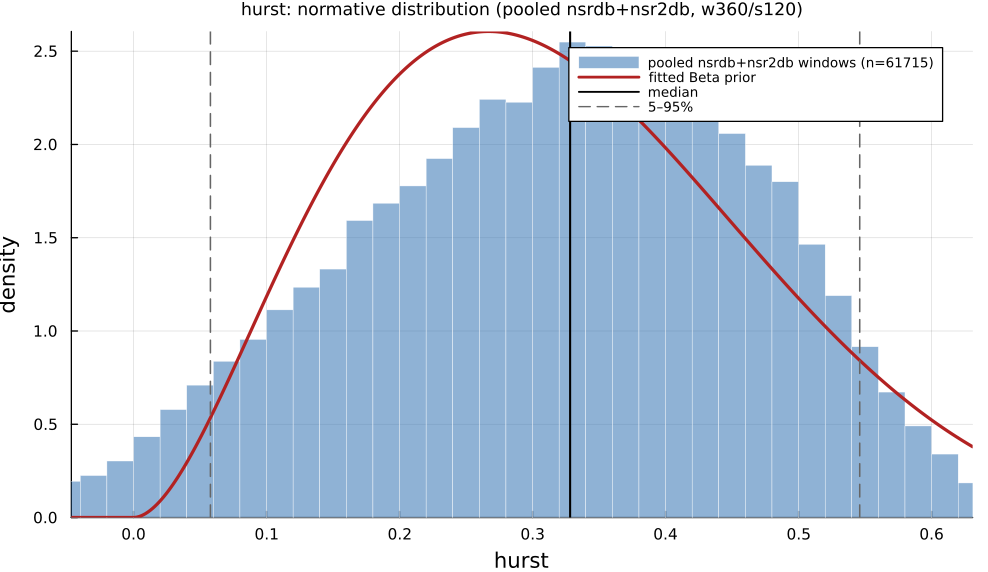
Empirical distribution over the pooled nsrdb+nsr2db normative windows (360-beat windows, 120-beat stride), overlaid with the fitted Beta prior density. Vertical lines mark the median and the 5–95% range.
Normal-range summary (pooled nsrdb+nsr2db)
| statistic | value |
|---|---|
| median | 0.3282 |
| IQR (25–75%) | 0.2131 – 0.4287 |
| 5–95% range | 0.05781 – 0.546 |
| mean ± sd | 0.3179 ± 0.1483 |
| n windows | 61715 |
n varies by feature only through per-window validity over the full pooled nsrdb+nsr2db table (n up to 61 715; e.g. sampen/mse drop windows where the statistic is undefined). ulf is the one exception: a 360-beat (~5 min) window contains no ULF-band power, so it uses a long-window NSRDB-only extraction (see its own page).
Use cases
- Long-range dependence / persistence of the RR series (Hurst 1951).
- Fractal-scaling and self-similarity research.
- Cross-check against the DFA exponents.
Applications by area
Evidence is reported at the measure-family level; a specific variant may not be the exact index measured in every cited study.
Clinical
Coverage: statistics. A pooled literature; reviews or meta-analyses exist.
Commonly and successfully used via DFA's α1 (a robust proxy for the Hurst exponent on short non-stationary cardiac records): lower α1 predicts higher mortality/sudden-cardiac-death risk across post-MI, heart-failure and elderly cohorts: one of the most replicated nonlinear-HRV findings in cardiology, remaining predictive after adjusting for LVEF and conventional covariates (pooled MD −0.17, 95% CI [−0.21, −0.13]).
Dominant reported direction: down: lower Hurst/α1 → higher mortality risk.
Key references: (Sen and McGill, 2018).
Sports & peak performance
Coverage: individual papers. A small, scattered literature with no pooled meta-analysis.
Uncommon as "Hurst exponent" per se, but moderately active as the DFA-α1 aerobic/ventilatory-threshold method: α1 declines from > 1 (correlated) toward ~0.75 at threshold and < 0.5 at high intensity, with very high threshold correlations in small samples: an actively contested literature (a 2025 large-sample validation found poor agreement, prompting a published rebuttal).
Dominant reported direction: down with exercise intensity (threshold-detection validity disputed).
Key references: (Gronwald and Hoos, 2020); (Cassirame et al., 2025); (Hoos and Gronwald, 2025).
Contemplative practice
Coverage: individual papers. A small, scattered literature with no pooled meta-analysis.
Rare but identifiable: a 2023 narrative review synthesizes ≥8 small studies (n = 8–70) mostly reporting a decrease in the Hurst/DFA scaling exponent during meditation (breakdown of long-range correlation), with one notable study reporting the opposite (increase) during "deep meditation" that the source review does not reconcile.
Dominant reported direction: mostly down, one unreconciled increase.
Key references: (Deka and Deka, 2023).
See the effect-distribution meta-analysis page for the harvested per-study effect sizes/p-values behind these domain summaries (docs/zoo_gen/effect_stats.csv).
Resources
Resource-intensity rank ◍◍◌◌◌ low is measured: median wall-clock time and allocations over a 360-beat window on synthetic realistic RR (docs/zoo_gen/bench_resources.jl; full grid in resource_bench.csv).
| metric (360-beat window) | value |
|---|---|
| cold median wall-time | 0.01982 ms |
| warm median wall-time | 0.01826 ms |
| allocations (cold) | 2.2 KiB |
Cold = fresh memoization caches (builds every shared representation from scratch); warm = shared representations (diff, periodogram, Poincaré coords, DFA fluctuation) already cached, so only this feature is recomputed. The tier is derived from the cold cost; see Nonlinear subgraph (template matching / embedding — O(N²) worst case).
Citation
Hurst exponent via rescaled-range (R/S) analysis, Hurst (1951).
Seminal reference(s): (Hurst, 1951).
See the References page for the full bibliography.