hf_relative
Hf Power As Proportion Of Total Power
| Aliases | hf_relative_power |
| Domain | frequency |
| Distribution family | Beta |
| Equation | HF / TP |
| Resource intensity | ◍◍◍◌◌ moderate, Frequency subgraph (requires a Welch/Lomb–Scargle periodogram first). Warm (shared representation cached) is 19× cheaper. (measured, see §Resources) |
Definition
HF power as proportion of total power. Formally: HF / TP.
What does normal look like?
Fitted normative prior: Beta(α = 1.312, β = 5.436), KS p = 3.2e-40, n = 61715.
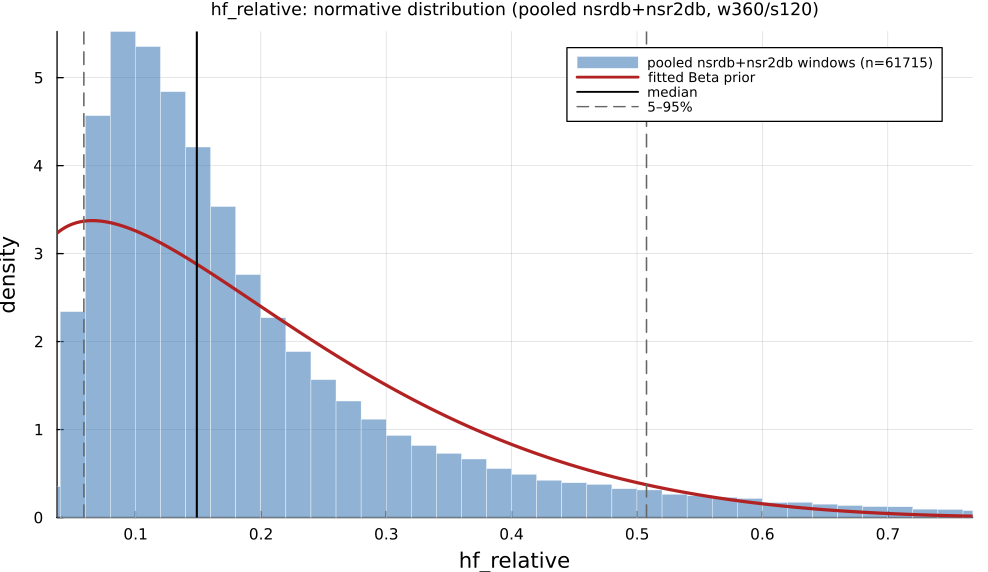
Empirical distribution over the pooled nsrdb+nsr2db normative windows (360-beat windows, 120-beat stride), overlaid with the fitted Beta prior density. Vertical lines mark the median and the 5–95% range.
Normal-range summary (pooled nsrdb+nsr2db)
| statistic | value |
|---|---|
| median | 0.149 |
| IQR (25–75%) | 0.09897 – 0.238 |
| 5–95% range | 0.0589 – 0.5076 |
| mean ± sd | 0.1944 ± 0.1422 |
| n windows | 61715 |
n varies by feature only through per-window validity over the full pooled nsrdb+nsr2db table (n up to 61 715; e.g. sampen/mse drop windows where the statistic is undefined). ulf is the one exception: a 360-beat (~5 min) window contains no ULF-band power, so it uses a long-window NSRDB-only extraction (see its own page).
Use cases
- Autonomic balance via spectral bands (LF/HF interpretation with care).
- Baroreflex and respiratory-sinus-arrhythmia studies.
- Longer recordings where spectral resolution is adequate.
Applications by area
Evidence is reported at the measure-family level; a specific variant may not be the exact index measured in every cited study.
Clinical
Coverage: statistics. A pooled literature; reviews or meta-analyses exist.
LF, HF and total power are consistently reduced in disease states (cardiac mortality risk, depression, anxiety, T2DM autonomic neuropathy) across large meta-analyses, but the LF/HF ratio itself is repeatedly non-significant in the very same datasets where its components move significantly, undercutting its billing as the most sensitive "sympathovagal balance" composite.
Dominant reported direction: down: LF/HF/TP reduced in disease; the LF/HF ratio specifically is often null.
Key references: (Rueda-Ochoa et al., 2024); (Wu et al., 2023); (Chalmers et al., 2014).
Sports & peak performance
Coverage: statistics. A pooled literature; reviews or meta-analyses exist.
Heavily used for training-load/overreaching monitoring, anchored by a 27-study meta-analysis; the intuitive "LF up / HF down under overload" model is directly contradicted by a body of work reporting paradoxical parasympathetic hyperactivity in overreached athletes, and the popular LF/HF > 4 "overtraining" cutoff is shown to be driven mainly by spontaneous breathing frequency rather than training state.
Dominant reported direction: contested: sympathetic-dominance model vs. parasympathetic-hyperactivity counter-evidence, confounded by respiration.
Key references: (Bellenger et al., 2016).
Contemplative practice
Coverage: statistics. A pooled literature; reviews or meta-analyses exist.
Commonly measured but shows null-to-mixed effects: the most direct meta-analysis (4 pooled trials) found no significant LF/HF change, and a well-powered 10-day mindfulness RCT likewise found no HF/LF-HF effect even though RMSSD rose: individual intensive-retreat studies show more mixed, technique- and task-dependent patterns confounded by voluntary breath-rate change.
Dominant reported direction: null-to-mixed, confounded by breathing.
Key references: (Rådmark et al., 2019).
See the effect-distribution meta-analysis page for the harvested per-study effect sizes/p-values behind these domain summaries (docs/zoo_gen/effect_stats.csv).
Resources
Resource-intensity rank ◍◍◍◌◌ moderate is measured: median wall-clock time and allocations over a 360-beat window on synthetic realistic RR (docs/zoo_gen/bench_resources.jl; full grid in resource_bench.csv).
| metric (360-beat window) | value |
|---|---|
| cold median wall-time | 0.05942 ms |
| warm median wall-time | 0.003197 ms |
| allocations (cold) | 32.2 KiB |
Cold = fresh memoization caches (builds every shared representation from scratch); warm = shared representations (diff, periodogram, Poincaré coords, DFA fluctuation) already cached, so only this feature is recomputed. The tier is derived from the cold cost; see Frequency subgraph (requires a Welch/Lomb–Scargle periodogram first). Warm (shared representation cached) is 19× cheaper.
Citation
HF power in normalised units (fraction of total power), Task Force (1996).
Seminal reference(s): (Task Force, European Society of Cardiology / North American Society of Pacing & Electrophysiology, 1996).
See the References page for the full bibliography.