mean
Mean Inter-Beat Interval
| Aliases | average, mean_rr, mean_nn |
| Domain | time, statistics |
| Distribution family | Normal |
| Equation | mean(IBI) |
| Resource intensity | ◍◌◌◌◌ very low, Level 1–2 (base statistics over successive differences). (measured, see §Resources) |
Definition
Mean inter-beat interval. Formally: mean(IBI).
What does normal look like?
Fitted normative prior: Normal(μ = 779.6, σ = 146.8), KS p = 1.4e-64, n = 61715.
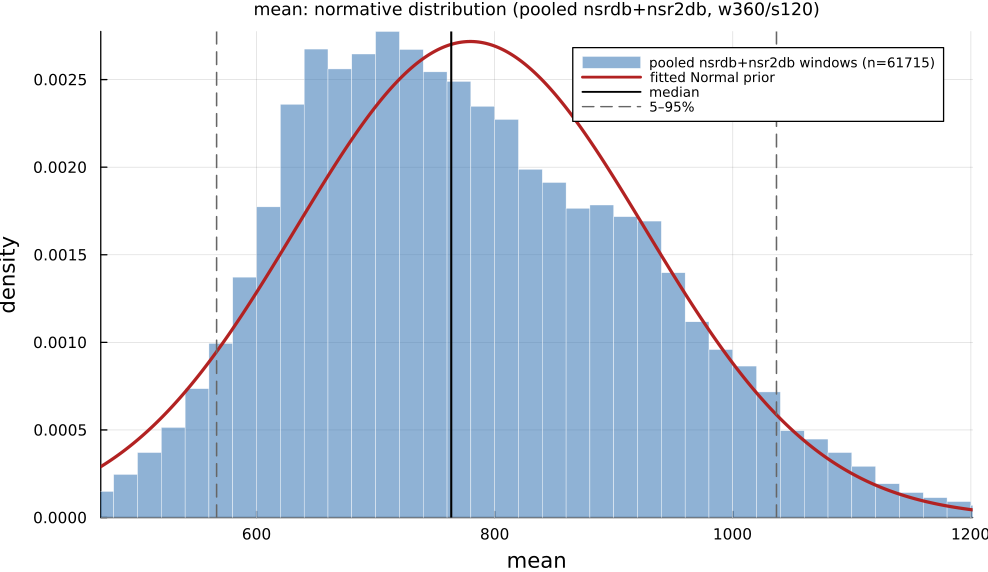
Empirical distribution over the pooled nsrdb+nsr2db normative windows (360-beat windows, 120-beat stride), overlaid with the fitted Normal prior density. Vertical lines mark the median and the 5–95% range.
Normal-range summary (pooled nsrdb+nsr2db)
| statistic | value |
|---|---|
| median | 763.5 |
| IQR (25–75%) | 668.9 – 881.7 |
| 5–95% range | 566.4 – 1037 |
| mean ± sd | 779.6 ± 146.8 |
| n windows | 61715 |
n varies by feature only through per-window validity over the full pooled nsrdb+nsr2db table (n up to 61 715; e.g. sampen/mse drop windows where the statistic is undefined). ulf is the one exception: a 360-beat (~5 min) window contains no ULF-band power, so it uses a long-window NSRDB-only extraction (see its own page).
Use cases
- Baseline heart period; denominator for normalised HRV indices.
- Resting-state and intervention comparisons.
- Sanity check on preprocessing / artifact removal.
Applications by area
Evidence is reported at the measure-family level; a specific variant may not be the exact index measured in every cited study.
Clinical
Coverage: statistics. A pooled literature; reviews or meta-analyses exist.
Elevated resting/mean heart rate is one of the most consistently replicated clinical predictors: dose-response meta-analyses pooling dozens of prospective cohorts (> 1.2 million subjects) show a near-linear rise in all-cause and cardiovascular mortality, coronary heart disease, heart failure and even cancer incidence per +10 bpm. Age-predicted HRmax (208 − 0.7·age) is itself a load-bearing exercise-testing constant from a 351-study meta-analytic pooling.
Dominant reported direction: up: higher resting HR → higher mortality/CV risk (≈RR 1.08–1.17 per 10 bpm).
Key references: (Zhang et al., 2016); (Aune et al., 2017); (Tanaka et al., 2001).
Sports & peak performance
Coverage: statistics. A pooled literature; reviews or meta-analyses exist.
Lower resting HR ("training bradycardia") and faster post-exercise heart-rate recovery (HRR) are classic, meta-analyzed markers of positive training adaptation, but the same meta-analysis found faster HRR also accompanies functional overreaching, so the identical directional signal reads as both "good" and "bad" depending on context.
Dominant reported direction: down at rest / faster HRR, but HRR speed alone cannot separate adaptation from overreaching.
Key references: (Bellenger et al., 2016).
Contemplative practice
Coverage: statistics. A pooled literature; reviews or meta-analyses exist.
A 45-RCT meta-analysis finds meditation reduces heart rate overall (concentrated in "open monitoring" styles), but this is contested: a more recent physiological study found HR unchanged or significantly increased during Chi/Kundalini-yoga meditation, explicitly arguing raw HR is a poor real-time biofeedback signal.
Dominant reported direction: contested: meta-analytic decrease vs. style-specific increase/no-change.
Key references: (Pascoe et al., 2017); (Natarajan, 2023).
Meditation's effect on HR level is disputed: a large meta-analysis reports a pooled decrease ((Pascoe et al., 2017)), but a more recent physiological study found HR unchanged (Chi meditation) or significantly increased (Kundalini Yoga), explicitly arguing raw HR is a poor real-time meditation biofeedback signal ((Natarajan, 2023)).
See the effect-distribution meta-analysis page for the harvested per-study effect sizes/p-values behind these domain summaries (docs/zoo_gen/effect_stats.csv).
Resources
Resource-intensity rank ◍◌◌◌◌ very low is measured: median wall-clock time and allocations over a 360-beat window on synthetic realistic RR (docs/zoo_gen/bench_resources.jl; full grid in resource_bench.csv).
| metric (360-beat window) | value |
|---|---|
| cold median wall-time | 0.002846 ms |
| warm median wall-time | 0.003116 ms |
| allocations (cold) | 736 B |
Cold = fresh memoization caches (builds every shared representation from scratch); warm = shared representations (diff, periodogram, Poincaré coords, DFA fluctuation) already cached, so only this feature is recomputed. The tier is derived from the cold cost; see Level 1–2 (base statistics over successive differences).
Citation
Basic descriptive statistic of the Task Force (1996) time-domain panel; no earlier single origin.
Seminal reference(s): (Task Force, European Society of Cardiology / North American Society of Pacing & Electrophysiology, 1996).
See the References page for the full bibliography.