sd1_sd2_area
Poincare Plot Ellipse Area
| Aliases | poincare_area |
| Domain | geometric |
| Distribution family | LogNormal |
| Equation | pi * SD1 * SD2 |
| Resource intensity | ◍◍◌◌◌ low, Geometric subgraph (Poincaré coords / RR histogram + reductions). Warm (shared representation cached) is 10× cheaper. (measured, see §Resources) |
Definition
Poincare plot ellipse area. Formally: pi * SD1 * SD2.
What does normal look like?
Fitted normative prior: LogNormal(μ = 8.214, σ = 1.011), KS p = 7.4e-16, n = 61715.
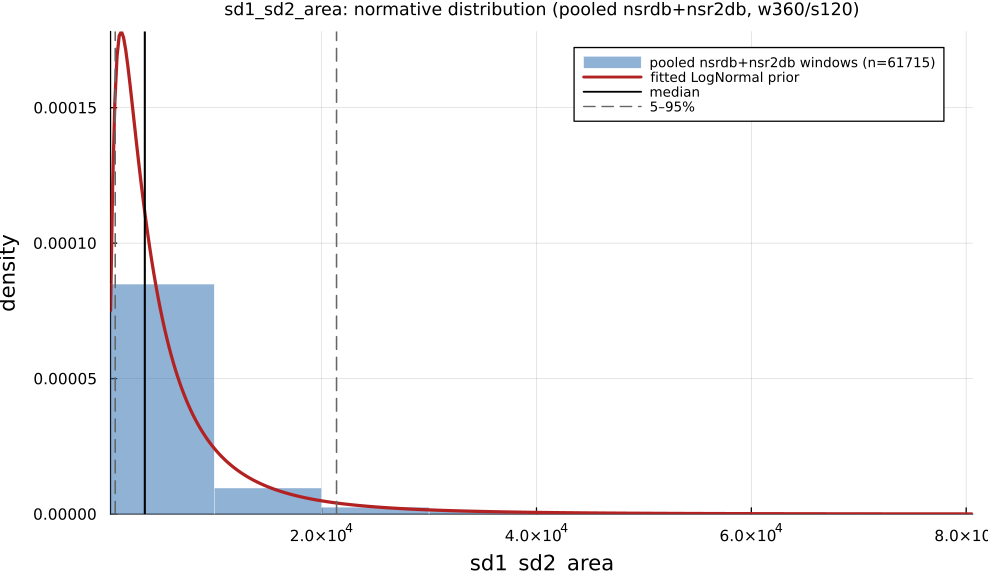
Empirical distribution over the pooled nsrdb+nsr2db normative windows (360-beat windows, 120-beat stride), overlaid with the fitted LogNormal prior density. Vertical lines mark the median and the 5–95% range.
Normal-range summary (pooled nsrdb+nsr2db)
| statistic | value |
|---|---|
| median | 3540 |
| IQR (25–75%) | 1837 – 6824 |
| 5–95% range | 785.7 – 2.139e+04 |
| mean ± sd | 6727 ± 1.305e+04 |
| n windows | 61715 |
n varies by feature only through per-window validity over the full pooled nsrdb+nsr2db table (n up to 61 715; e.g. sampen/mse drop windows where the statistic is undefined). ulf is the one exception: a 360-beat (~5 min) window contains no ULF-band power, so it uses a long-window NSRDB-only extraction (see its own page).
Use cases
- Total Poincaré-ellipse dispersion (π·SD1·SD2).
- Compact geometric summary of overall variability.
- Robust-to-artifact field-recording summary.
Applications by area
Evidence is reported at the measure-family level; a specific variant may not be the exact index measured in every cited study.
Clinical
Coverage: statistics. A pooled literature; reviews or meta-analyses exist.
A well-established clinical output across cardiology, endocrinology and psychiatry: lower SD1/SD2 (reduced beat-to-beat and long-term variability) consistently marks worse disease state, though most reported sample sizes are small (n = 18–95). SD1 is mathematically identical to RMSSD (SD1 = RMSSD/√2), so papers reporting both as independently "significant" double-count the same statistic, and the SD2/SD1 ratio's billing as a "sympathovagal balance" surrogate is directly contested.
Dominant reported direction: down: lower SD1/SD2 → worse disease state.
Key references: (Ciccone et al., 2017); (Rahman et al., 2018); (Stuckey et al., 2014).
Sports & peak performance
Coverage: individual papers. A small, scattered literature with no pooled meta-analysis.
Largely restates RMSSD-based vagal-tone monitoring in geometric form (SD1 = RMSSD/√2), plus an SD2/SD1 "stress score" aimed at overreaching detection; SD1 rises with aerobic training and falls with acute intensity/overtraining, though overtraining shows a non-monotonic pattern (higher than sedentary, far below trained) and no meta-analysis isolates a Poincaré-specific effect size distinct from RMSSD.
Dominant reported direction: up with training, down acutely/with overtraining (same underlying signal as RMSSD).
Key references: (Bellenger et al., 2016); (Ciccone et al., 2017).
Contemplative practice
Coverage: individual papers. A small, scattered literature with no pooled meta-analysis.
A handful of small, likely underpowered studies (n = 8–18) report SD1/SD2-ratio changes across meditation traditions, but the direction of SD2 and total Poincaré-plot area disagrees between the two studies that report it: exploratory, not established.
Dominant reported direction: inconsistent across the two available small studies.
Key references: (Ciccone et al., 2017).
See the effect-distribution meta-analysis page for the harvested per-study effect sizes/p-values behind these domain summaries (docs/zoo_gen/effect_stats.csv).
Resources
Resource-intensity rank ◍◍◌◌◌ low is measured: median wall-clock time and allocations over a 360-beat window on synthetic realistic RR (docs/zoo_gen/bench_resources.jl; full grid in resource_bench.csv).
| metric (360-beat window) | value |
|---|---|
| cold median wall-time | 0.03211 ms |
| warm median wall-time | 0.003296 ms |
| allocations (cold) | 32.9 KiB |
Cold = fresh memoization caches (builds every shared representation from scratch); warm = shared representations (diff, periodogram, Poincaré coords, DFA fluctuation) already cached, so only this feature is recomputed. The tier is derived from the cold cost; see Geometric subgraph (Poincaré coords / RR histogram + reductions). Warm (shared representation cached) is 10× cheaper.
Citation
Poincaré ellipse area π·SD1·SD2, Brennan et al. (2001); Task Force (1996) geometric methods.
Seminal reference(s): (Brennan et al., 2001); (Task Force, European Society of Cardiology / North American Society of Pacing & Electrophysiology, 1996).
See the References page for the full bibliography.